
Introduction: Why Training Metrics Matter More Than Ever
Training investment in the United States reached $102.8 billion in 2025, yet only 30% of organizations are good at using learning data to make business decisions. That gap explains why many small to mid-size businesses struggle to answer a simple question: Is our training actually working?
When budgets tighten, training is often the first line item scrutinized. Without hard data proving its value, it's vulnerable to cuts. The challenge is especially acute for SMBs, where every dollar counts and smaller HR teams rarely have time to build sophisticated measurement systems.
This guide solves that problem. You'll learn 15 actionable training metrics organized into three categories: foundational, effectiveness, and business impact. They help you track participation, measure learning, and demonstrate ROI to leadership—whether you're building a measurement habit from scratch or tightening an existing framework.
Key Takeaways
- Participation, completion, and satisfaction scores establish baseline visibility into training activity
- Knowledge retention, on-the-job application, and engagement show whether employees actually learn and use new skills
- ROI, performance gains, and employee retention connect training directly to organizational outcomes
- Small HR teams should start with 5–7 metrics tied to business priorities, not all 15 at once
- Expect measurement difficulty to rise as you move from activity tracking to business impact and ROI
What Are Training and Development Metrics?
Training and development metrics are quantifiable measures that track how learning programs affect individual skill and organizational performance.
These metrics serve multiple purposes for SMBs:
- Justify training budgets by demonstrating value to leadership
- Identify what's working and what isn't, so you can refine programs
- Align learning with business goals by measuring outcomes that matter to your organization
- Demonstrate ROI through concrete data rather than anecdotal feedback
Vanity Metrics vs. Value Metrics
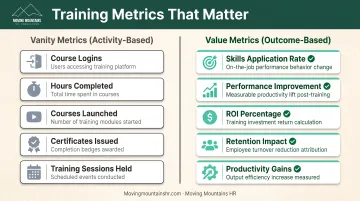
Not all metrics carry equal weight. Vanity metrics are activity-based measures like logins, hours completed, or courses launched. They're easy to collect but don't tell you whether training changed behavior or improved results.
Value metrics are outcome-based. They tie learning to business results: higher sales win rates, fewer compliance violations, faster time to competency, or clear ROI.
They take more effort to track, but they show whether training actually moved the needle.
Strong measurement frameworks use both. Activity metrics give you baseline visibility; outcome metrics prove business impact.
Why Training Metrics Matter for Small to Mid-Size Businesses
SMBs face unique constraints that make measurement even more critical than for large enterprises:
Limited budgets mean higher scrutiny. When you have $100,000 to spend on training versus $10 million, every program must prove its worth. Data-driven decisions help you invest in what works and cut what doesn't.
Smaller HR teams can't afford guesswork. According to SHRM's Human Capital Benchmark Report, the average company has 1.7 HR staff per 100 employees. Most lack dedicated learning professionals, so you need metrics that deliver insight without eating up hours.
Talent competition demands proof of commitment. In tight labor markets, development opportunities are a competitive advantage. Metrics help you show prospective and current employees that you genuinely invest in their growth.
Strategic measurement levels the playing field. Just as fractional HR services bring executive-level expertise to businesses of all sizes, a clear metrics framework helps SMBs measure training the way larger organizations do. You get the insight without the overhead of a full-time analytics team.
Category 1: Foundational Training Metrics (The Starting Point)
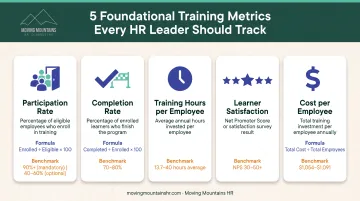
These five metrics provide baseline visibility into training participation and satisfaction. They're essential for any organization beginning to measure effectiveness.
Training Participation Rate
Definition: The percentage of eligible employees who enroll in and begin a training program.
Formula: (Number of employees who started training ÷ Total number of eligible employees) × 100
What good looks like:
- For mandatory training (compliance, safety): aim for 90%+ participation
- For optional development programs: 40-60% is typical and healthy
Low participation in mandatory training signals communication gaps, scheduling conflicts, or unclear expectations. Low optional participation may indicate programs aren't relevant to employees' career goals or daily work.
Course Completion Rate
Definition: The percentage of employees who finish a training program after starting it.
Formula: (Number of employees who completed training ÷ Number of employees who started training) × 100
Benchmarks:
- 70-80% for mandatory training is acceptable
- 50-60% for optional courses is normal
- Rates significantly below these thresholds signal issues with content relevance, course design, or time allocation
Track completion separately by program type. A 45% completion rate for a voluntary leadership series may be fine, while the same rate for required harassment prevention training indicates a serious gap.
Training Hours per Employee
Definition: The average number of hours employees spend in learning activities annually or per quarter.
Formula: Total training hours completed ÷ Total number of employees
Industry context: According to ATD's 2025 State of the Industry report, companies provided an average of 13.7 formal learning hours per employee in 2024. Training magazine's 2025 survey reported 40 total hours per employee when including informal learning.
More hours don't automatically mean better outcomes. Quality and relevance matter more than quantity. Use this metric to track trends over time and ensure employees have adequate learning opportunities, not to maximize hours for their own sake.
Learner Satisfaction Score
Definition: A measure of how satisfied employees are with the training experience, typically collected through post-training surveys.
Measurement approaches:
- Net Promoter Score (NPS): "How likely are you to recommend this training to a colleague?" (0-10 scale)
- Standard satisfaction ratings: 1-5 stars or Likert scale questions
What scores indicate:
- NPS above 30 is good; above 50 is excellent
- Satisfaction scores above 4.0/5.0 suggest training is well-received and relevant
Collect qualitative feedback alongside ratings. Open-ended questions reveal why scores are high or low and provide actionable insight for improving future programs.
Training Cost per Employee
Definition: The total investment in training divided by the number of employees trained.
Formula: Total training costs (development, delivery, materials, employee time) ÷ Number of employees trained
Benchmark context: According to ATD's 2025 data, direct training expenditure averaged $1,054 per employee and $165 per learning hour in 2024. Training magazine reported an average of $1,091 per learner at small companies in 2025.
Don't optimize for cost alone. Lower cost per employee isn't always better if it comes at the expense of quality or impact. Focus on cost per outcome. For example, track cost per competent sales rep or cost per percentage point reduction in safety incidents.
Category 2: Learning Effectiveness Metrics (Does Learning Stick?)
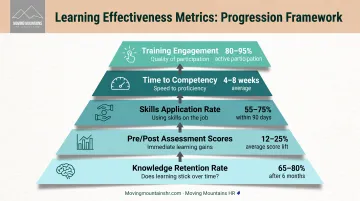
These five metrics go beyond participation to measure whether employees are actually learning, retaining, and applying new knowledge and skills.
Knowledge Retention Rate
Definition: The percentage of learned information employees retain over time, typically measured through follow-up assessments 30-90 days after training.
Measurement approach: Compare post-training assessment scores with follow-up assessment scores weeks or months later.
Formula: (Follow-up assessment score ÷ Immediate post-training assessment score) × 100
The forgetting curve: Without reinforcement, people forget much of what they learn quickly. Spaced repetition (revisiting content at intervals) and practical application help combat this natural decline. Follow-up assessments reveal whether your reinforcement strategies are working.
Pre- and Post-Training Assessment Scores
Definition: The measurable improvement in knowledge or skill levels from before training to immediately after completion.
Formula: [(Post-training score - Pre-training score) ÷ Pre-training score] × 100 = percentage improvement
How to use this metric: It directly demonstrates learning effectiveness and helps identify which programs deliver the strongest knowledge gains. If a compliance program shows only 10% improvement while a sales-skills workshop shows 45%, you know where redesign efforts should focus.
Pair this metric with retention and application measures. Strong immediate improvement that doesn't persist or translate to workplace behavior has limited business value.
Skills Application Rate
Definition: The percentage of trained employees who actively apply newly learned skills in their day-to-day work.
Measurement approaches:
- Manager observations using structured rubrics
- Self-reporting through surveys or journals
- Performance data showing behavior change (such as using a new software feature or applying a new sales technique)
Critical insight: This is where training transforms from "checked box" to actual performance improvement. Low application rates below 30% indicate a gap between learning and workplace implementation. Common causes include:
- Lack of manager support or reinforcement
- No clear opportunity or expectation to use new skills
- Workplace barriers (outdated tools, conflicting processes)
- Skills aren't relevant to employees' actual work
Time to Competency
Definition: The average time required for employees to achieve proficiency in a skill or role after completing training.
Measurement: Track the time from training completion to reaching defined performance benchmarks. Examples:
- Sales reps closing their first deal independently
- Customer service reps handling calls without supervisor assistance
- New managers conducting their first performance review
Business value: Faster time to competency means quicker ROI on training investment and reduced productivity loss during learning curves. Benchmarks vary widely by role complexity: 2-4 weeks for retail positions, 3-6 months for technical sales roles.
Establish clear competency definitions before measuring. "Proficiency" must be observable and consistent across employees.
Training Engagement Rate
Definition: The quality and depth of learner interaction with training content, beyond simple completion.
Tracking indicators:
- Time spent actively engaging with content (not just having it open)
- Completion of optional activities or practice exercises
- Questions asked during or after sessions
- Participation in discussions or peer learning
Why engagement matters: Engaged learners retain more, apply skills more consistently, and achieve better performance outcomes. Low engagement often signals content isn't relevant, too lengthy, or poorly designed.
For virtual training, analytics dashboards in your LMS can reveal engagement patterns. For in-person programs, facilitator observations and post-session surveys provide insight.
Category 3: Business Impact Metrics (Where Training Delivers Results)
These five metrics connect training directly to organizational performance and bottom-line results: the measures that matter most to business leaders.
Performance Improvement (KPI Impact)
Definition: Measurable improvements in job-specific KPIs directly attributable to training interventions.
Formula: [(Post-training KPI value - Pre-training KPI value) ÷ Pre-training KPI value] × 100 = percentage improvement
Examples by function:
- Sales training: Improved win rates, higher average deal size, shorter sales cycles
- Customer service training: Reduced resolution time, increased CSAT scores, fewer escalations
- Compliance training: Fewer incidents or violations, faster audit completion
Measurement challenge: You must isolate training's effect from other influences (new tools, process changes, market conditions). Use control groups, trend analysis, or manager assessments to strengthen attribution.
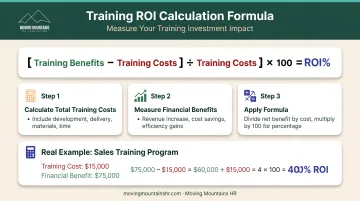
Training Return on Investment (ROI)
Definition: The financial return generated by training compared to the cost of delivering it.
Formula: [(Training benefits in dollars - Training costs) ÷ Training costs] × 100 = ROI percentage
Example: A sales training program costs $15,000 to develop and deliver. Participants collectively generate $75,000 in additional revenue attributable to the training.
ROI = [($75,000 - $15,000) ÷ $15,000] × 100 = 400%
The challenge: Calculating benefits requires connecting training to measurable business outcomes such as increased revenue, cost savings, and efficiency gains. The ROI Institute methodology recommends isolating training's effect through control groups, trend analysis, or forecasting.
Practical advice: Don't calculate ROI for every course. Focus on your most impactful programs—typically your top 5-10%—where the investment in measurement is justified by the business value at stake.
Employee Retention Rate (Training Impact)
Definition: The rate at which employees who participate in training stay with the company compared to those who do not.
Measurement approach:
- Compare retention rates for employees who completed development training vs. those who didn't
- Track retention rates before and after implementing robust training programs
- Survey exit interviews to understand whether lack of development contributed to departures
The business case: According to SHRM, replacing an employee can cost 50-200% of their annual salary, depending on the role. Training investments that improve retention by even 5-10% can produce substantial cost savings.
A Harvard Business School study of a Colombian federal agency found that trained frontline workers were more likely to remain with the organization for three years, creating a dual return through both productivity and retention.
Productivity Gains
Definition: Measurable increases in output, efficiency, or quality resulting from training.
Measurement methods:
- Tasks completed per hour
- Revenue per employee
- Error or defect rates
- Time to complete standard processes
Formula: [(Post-training productivity metric - Pre-training productivity metric) ÷ Pre-training productivity metric] × 100 = percentage productivity gain
Real-world example: In the Colombian federal-agency study, trained frontline workers completed roughly 10% more work, managers completed 3% more strategic goals, and supervisors closest to trained workers improved productivity about 8%.
Track productivity over time. Initial gains often level off as employees reach a new performance plateau. Refresher training or advanced programs may be needed at that stage.
Compliance Certification Rate
Definition: The percentage of employees who have completed required compliance training and hold current certifications.
Formula: (Number of employees with current compliance certifications ÷ Total number of employees requiring certification) × 100
Why it matters: For regulated industries or required training (safety, harassment prevention, data security), the only acceptable rate is 100%. Tracking this metric protects the organization from legal and financial risk.
Documentation requirements: OSHA regulations require specific records including operator name, training date, evaluation date, and trainer/evaluator identity. Your tracking system must capture these details and flag upcoming expiration or recertification requirements.
How to Start Measuring Training Metrics: A Practical Guide for SMBs
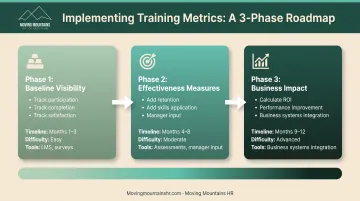
Small HR teams can't track all 15 metrics for every program. Start with 5–7 metrics tied to your top business priorities, then build in three phases as your capacity grows.
Take a Phased Approach
Phase 1: Establish baseline visibility Begin with participation, completion, and satisfaction. Your LMS and post-training surveys make these easy to collect, and they quickly show whether programs reach employees and meet basic quality standards.
Phase 2: Layer in effectiveness measures Next, add knowledge retention and skills application. Follow-up assessments and manager input take more effort, but they show whether learning sticks and shows up on the job.
Phase 3: Focus on business impact Finally, calculate ROI and performance improvement for programs tied to revenue, compliance risk, or strategic capabilities. Linking learning data to business systems takes work, but it gives leadership the proof it needs.
Leverage Available Data Sources
- LMS analytics: Completion rates, time spent, assessment scores, engagement
- Post-training surveys: Satisfaction, relevance, planned application
- Manager assessments: Skills application and performance changes on the job
- Business systems: HRIS retention data, CRM sales metrics, performance tools for KPI trends
Most SMBs already have these systems. Connect them so they tell one clear story about training impact.
When to Bring in External Expertise
If building a measurement framework feels overwhelming, an HR consultant or fractional CHRO can help you:
- Identify which metrics matter most for your business
- Set up efficient data collection
- Create clear reports for leadership
- Train managers to assess skills application and performance impact
Moving Mountains HR works with small to mid-size businesses to design training that fits their goals and to put simple measurement practices in place—from compliance training to leadership development—so you can show what is working without building a full HR analytics function in-house.
Frequently Asked Questions
What are L&D metrics?
L&D (Learning and Development) metrics are quantifiable measures used to evaluate the effectiveness, efficiency, and business impact of employee training programs. They range from basic activity tracking—who completed training—to strategic measures that link learning to business results like improved sales performance or reduced compliance violations.
What are 5 examples of metrics to measure performance?
Five common performance-related training metrics are skills application rate, performance improvement / KPI impact, productivity gains, time to competency, and training ROI.
What are the levels of training evaluation?
The Kirkpatrick Model has four levels: Reaction (satisfaction), Learning (knowledge/skills), Behavior (on-the-job application), and Results (business impact). The ROI Institute methodology adds Level 5 (ROI) to quantify financial return.